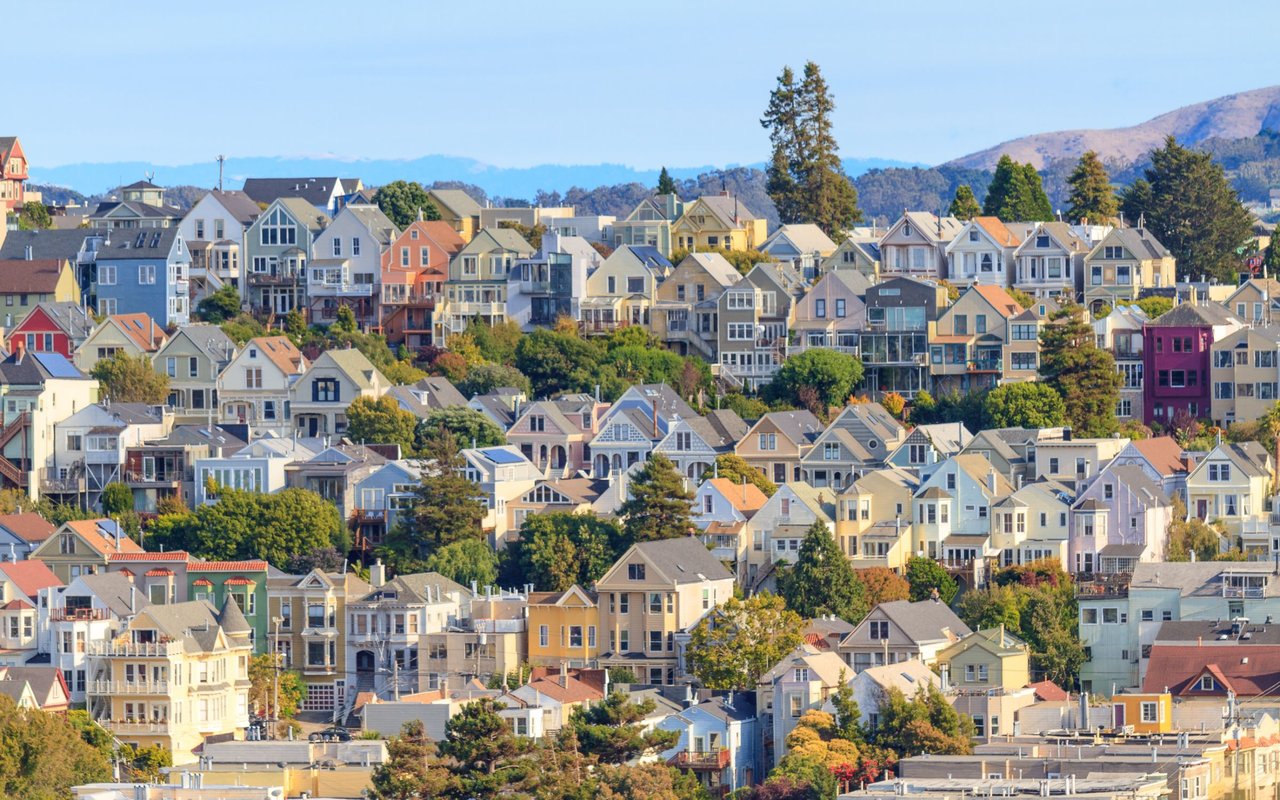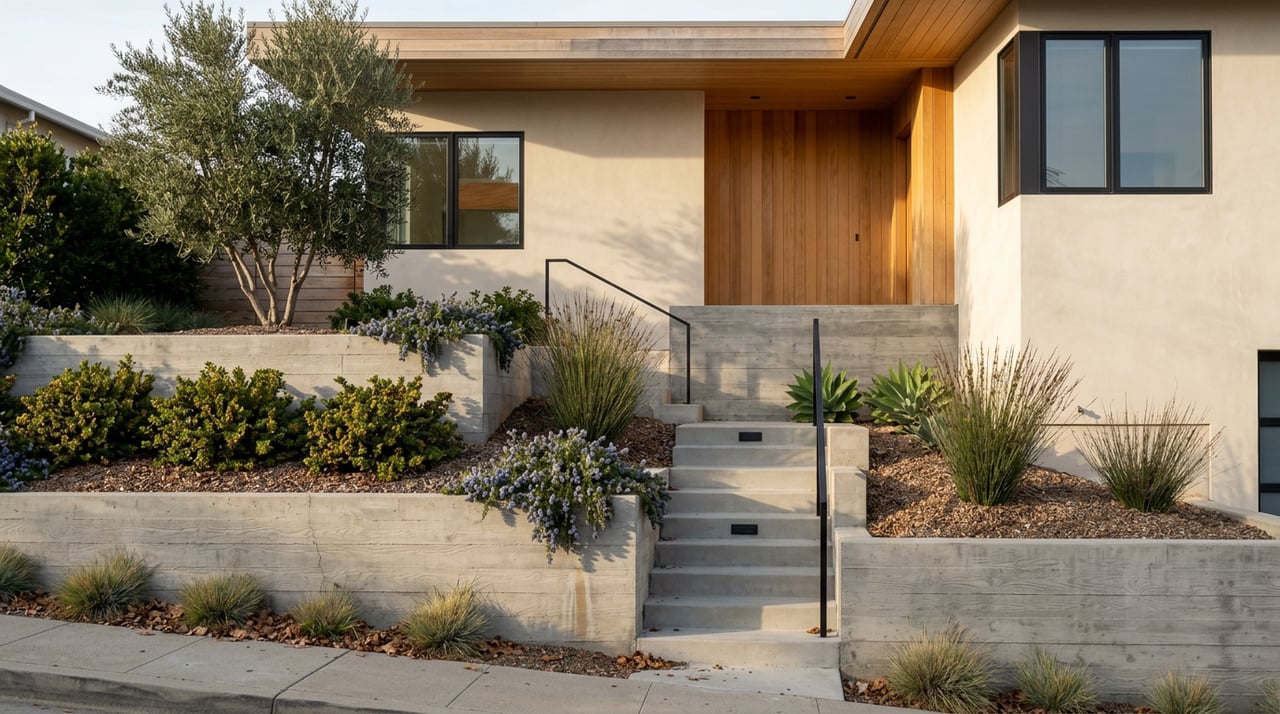
Picture two open houses on the same Saturday, both inside Alameda County, both listed as ordinary single-family homes. One sits a few blocks off College Avenue with a remodeled kitchen and a line of people waiting to sign in. The other sits in the flats a few miles south, similar square footage, similar bones, and a fraction of the foot traffic. The listing agent for the second house will tell you it's priced to move. The listing agent for the first will tell you to bring your best offer. Both homes are, technically, in the same county market report, and that report will tell you the county is having a good year.
It is, on paper. Over the three months ending May 2026, the median sale price across Alameda County was roughly $1.2 million, up 5.4 percent from the same period a year earlier. But that single number is doing a lot of hiding. Break it apart by city and neighborhood, using the same three-month window, and you find places that surged and places that fell, sometimes by double digits, all inside one county, all in the same quarter.
One Number, Eight Different Markets
Here's what the county number looks like once you split it by place, all using the same three-month window ending May 2026:
| Area | Median sale price | Change vs. same period last year |
|---|---|---|
| Piedmont | $3.1M | +9.8% |
| Oakland (Upper Rockridge) | $1.8M | +22.0% |
| Oakland (Rockridge) | $1.9M | -5.5% |
| Berkeley | $1.5M | -1.9% |
| Alameda (island city) | $1.1M | -11.9% |
| Oakland citywide | $884K | +2.8% |
| Oakland (Fruitvale) | $632K | -7.7% |
| Alameda County overall | $1.2M | +5.4% |
Look at the direction column, not just the dollar figures. Piedmont and Upper Rockridge each posted strong double-digit gains. Rockridge proper, one street over from Upper Rockridge, fell. Alameda's island city fell by almost 12 percent. Fruitvale fell too. The county headline of "up 5.4 percent" isn't describing a market that's broadly appreciating. It's describing a market where a handful of places pulled the average up while a larger number of named neighborhoods actually got cheaper.
Why a 35.8 Percent Jump Doesn't Mean What It Sounds Like
Piedmont deserves a second look, because its numbers are the most dramatic in the table and the most misleading if you don't ask how they were built. The median sale price there rose 9.8 percent, which is already a strong move. But the average sale price for the most recent month was up 35.8 percent year over year. That gap between median and average is a tell.
Piedmont is a small city. Only 43 homes sold there in May 2026, up from 27 the year before. When your entire monthly sample is a few dozen transactions, one or two exceptionally expensive sales can drag the average up far more than they move the median, which is more resistant to outliers by design. A 35.8 percent jump in the average doesn't necessarily mean typical Piedmont buyers are paying a third more than they were last year. It more likely means a few unusually large transactions landed in a small sample. The median's smaller but still real 9.8 percent gain is probably closer to what an ordinary buyer actually experienced.
This matters beyond Piedmont. Anytime you're comparing a neighborhood-level statistic built from a small number of monthly sales, whether it's Upper Rockridge's 25 May transactions or Rockridge's 9, treat single-month swings as noisy and lean on the three-month or twelve-month view instead.
Two Data Providers, Two Different Verdicts on the Same County
Here's a second layer of the same problem, and it's one most buyers never think to check. Redfin's county-level figure says Alameda County's median sale price was up 5.4 percent over the three months ending May 2026. Zillow's countywide typical home value, as of June 30, 2026, was down 8.3 percent over the same twelve-month stretch. Same county, similar timeframe, opposite direction.
Neither number is wrong. They're measuring different things. Redfin's figure is the median of homes that actually closed escrow in a given window, which shifts with the mix of what sold, expensive homes one month, more modest ones the next. Zillow's typical value index tries to estimate the value of a consistent basket of homes over time, including ones that didn't sell, which smooths out mix shift but responds differently to a slowing market. When you see a county-wide statistic in a portal search, it's worth asking which of these two approaches produced it, because they can tell you opposite stories from the same underlying market.
The Zoning Vote That Could Reshape Rockridge
Here's a piece of this story a portal search won't surface. In March 2026, the Oakland City Council voted to move forward with upzoning around the Rockridge BART station, part of the state's SB 79 push to encourage denser housing near transit stops. Over time, this could mean more condos and townhomes get built in one of the county's most land-constrained, highest-demand corridors.
That context makes Rockridge's own internal split more interesting. Rockridge proper, the walkable core near College Avenue and the BART station, saw its median sale price fall 5.5 percent over the same three-month window even as Upper Rockridge, a few blocks up the hill with larger lots and less walkability, gained 22 percent. Two segments of the same named neighborhood moved in opposite directions in the same quarter, before any new supply from the upzoning vote has had time to land. Entitlement and construction timelines in the East Bay typically stretch years past a council vote, so this isn't a signal to expect cheaper condos near the BART station next year. It's a reason to watch that specific corridor over the next several years rather than assume Rockridge's premium is fixed in place.
What This Means If You're Underwriting Rental Units
If you're looking at Alameda County for a duplex or fourplex rather than a primary residence, the county's overall price direction matters less than two other numbers.
First, financing thresholds. Alameda County's high-balance loan limit for 2026 is $1,209,750, the ceiling for conventional and FHA-backed financing before you cross into jumbo territory. That ceiling is the same whether you're shopping in Fruitvale or Piedmont, which means it stretches dramatically further in one than the other.
Second, and more important for actual cash flow: rent control. Oakland's Rent Adjustment Program and Berkeley's Rent Stabilization Ordinance both cap how much you can raise rent on sitting tenants and require just cause before ending a tenancy. Neither shows up in a listing's advertised cap rate, and both change what that cap rate means once you own the building. A duplex in Fruitvale and a duplex in Berkeley can look identical on a spreadsheet and behave very differently once you're the landlord of record.
The Pace Hasn't Slowed Even Where Prices Have
One more thing the median obscures: how quickly homes are still moving, even in the neighborhoods where prices cooled. Across Alameda County, homes sold in an average of 17 days over the three months ending May 2026, barely slower than 16 days the year before. Sales volume actually rose, with 1,014 homes sold in May 2026 compared to 945 in the same month a year earlier.
Oakland's pace tells a similar story. Homes there received an average of 4 offers over the same window, sold for roughly 13 percent above list price on average, and the hottest listings went for closer to 28 percent above list, pending in around 13 days. A neighborhood's price can fall year over year and still sell in under three weeks with multiple offers. Slower price growth is a different statement than a slower market, and buyers waiting for a broad pullback are watching the wrong number.
A Few Questions Worth Asking Before You Compare Cities
Redfin says the county is up. Zillow says it's down. Which one should I trust? Neither is more "correct." Redfin's median reflects the actual mix of homes that sold in a given window. Zillow's typical value index tracks a consistent basket of homes over time. Ask which methodology matches the question you're actually asking, whether that's "what did homes like mine sell for recently" or "how has value trended for a typical home."
A neighborhood posted a double-digit gain. Should I rush to buy there before it goes higher? Check the sales volume behind that number first. A double-digit move built on a few dozen transactions, like Piedmont's, can reflect a handful of unusual sales rather than a durable shift. A similar move built on hundreds of sales is a different kind of signal.
Does the county-wide direction matter if I'm buying a rental property? Less than you'd expect. Your cash flow depends far more on the specific city's rent control ordinance and just-cause rules than on whether the county median rose or fell that quarter.
If you're comparing cities across Alameda County and trying to figure out which number actually applies to your budget, that's exactly the conversation worth having before you write an offer. Cj Salazar works buyers and investors through this kind of neighborhood-by-neighborhood comparison across the Peninsula and East Bay every week. Schedule a free consultation and bring your list of cities. We'll figure out which ones are actually answering the question you're asking.